terminal-dashboard v0.0.5

I’ve made a lot of progress on the testing for the dashboard tool, I’m at about 80% coverage across the whole codebase. It was interesting getting the fixtures written for each of the different data sources so that they could be tested. I also added some features for testing and also some refactoring to enable testing. I moved most of the code for loading and processing the configuration file out of the main script and into a separate module. This allows those functions to be tested in isolation but also they now represent a usable API in their own right. I didn’t want to include the config code directly in the dashboard module since it is coupled to all of the different types of data sources and their dependencies. This way the dashboard code could be used with totally alternative graph objects or data table objects without any direct coupling to those specific implementations or their dependencies.

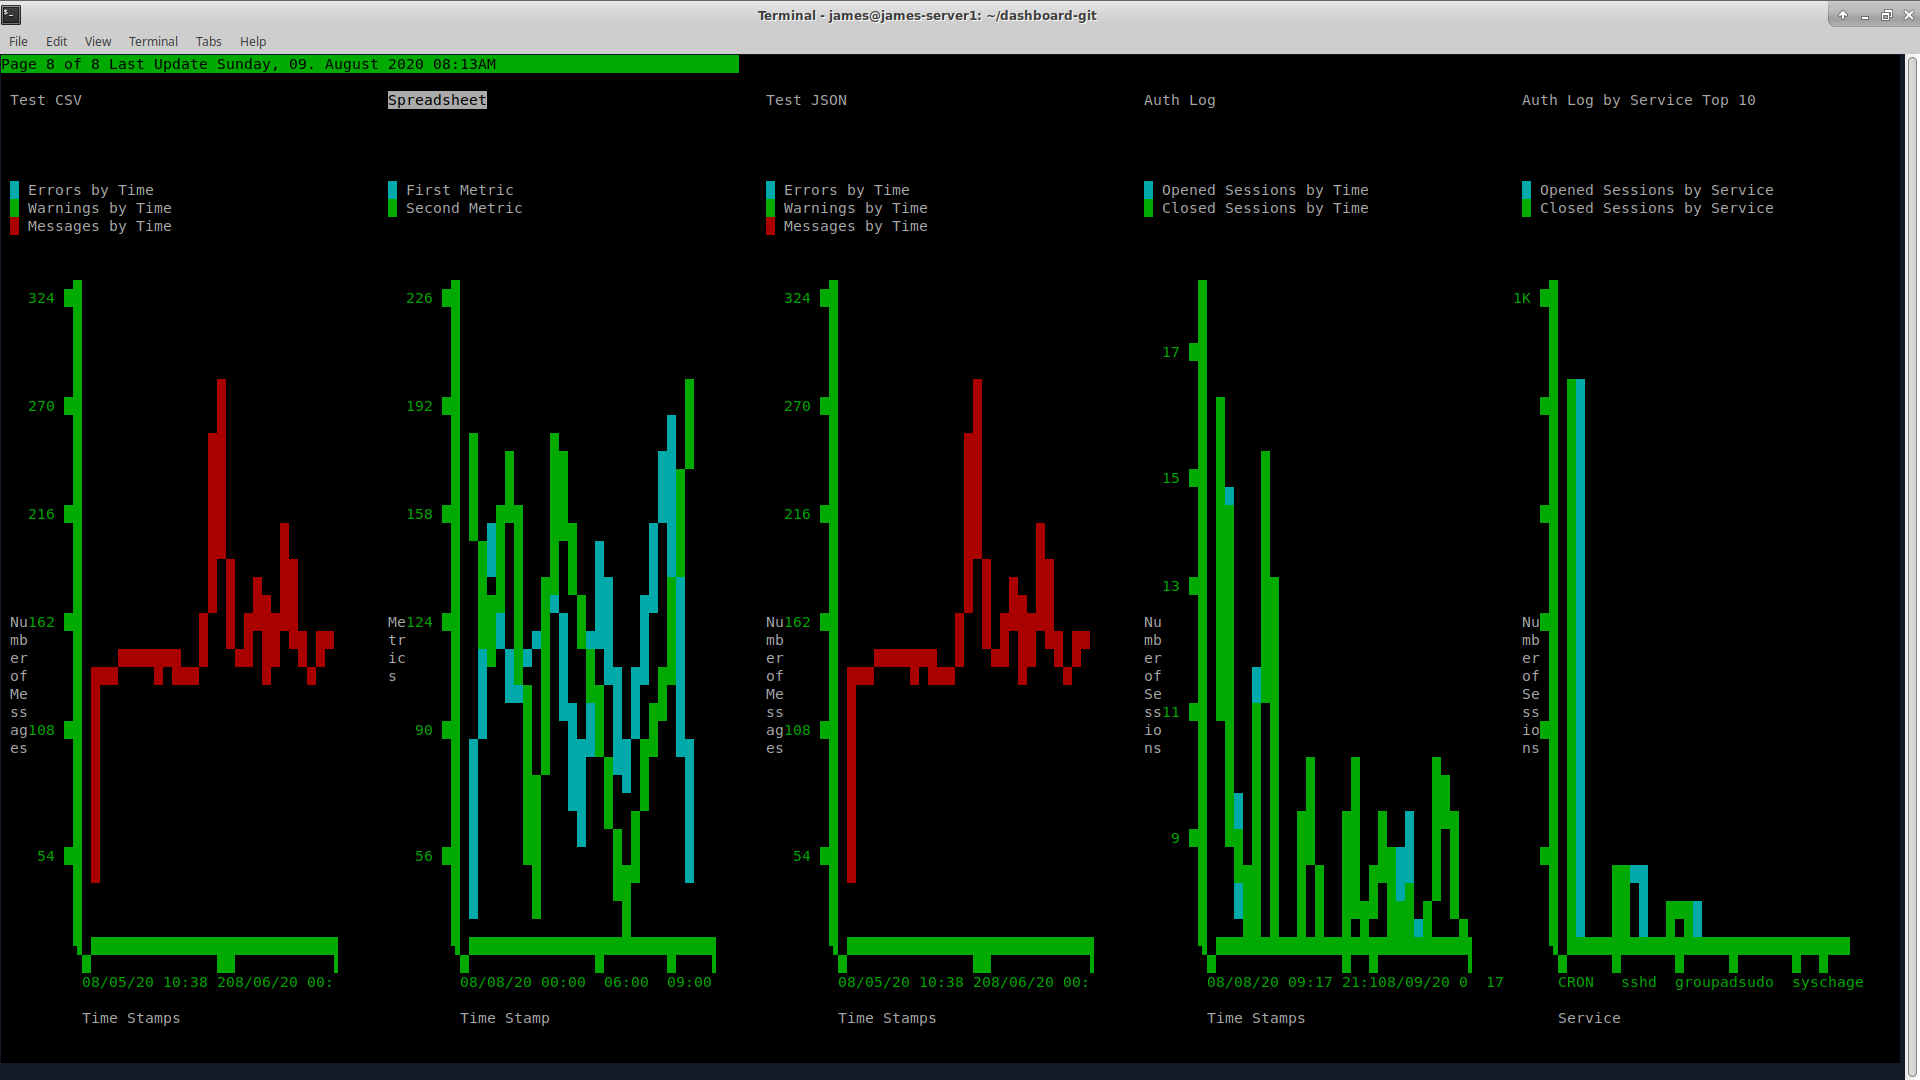
I used a model of snapshot comparison to verify the graphics rendering code, this involved creating static data sets and controlling the screen size carefully. It also requires some honesty on the part of the tester to carefully verify the renderings and not accept bugs. I have at least one bug in my example dashboard that I so-far haven’t been able to reproduce in the test automation… but it is on my list to track down.

My plan is to finish getting through the CLI and config testing and then on to the next round of features and enhancements.
Software Project: terminal-dashboard v0.0.1

Back in 2017 when I was working at Elastic and leading the Kibana team ( Kibana if you don’t know is a web based tool for querying, analyzing, and visualizing data that is stored in elasticsearch, which has as one of it’s core use cases rendering dashboards for collections of operational monitoring data in data centers ) and being the contrarian that I am, I thought: “What about the green screen folks who manage lots of systems, only use the command line and a terminal, and who would balk at installing a whole server just to run Kibana? Why can’t we have a dashboard tool that presents graphs of the same data in a terminal window?” Probably an insane idea, but you’re reading the words of someone who wrote graphical games for the TRS-80 Model I so it didn’t seem insane to me… So I started out using curses and block graphic characters to create a drawing package with all the essential graphics primitives. Then I built a data table abstraction to allow flexible access to the data without too much coupling… Then things got really busy at work and my attention span disappeared and I put the project aside.

Three intense years later I’m retired and I’m spending some time converting old projects to Python 3, moving old svn repos to git, and I come across this project again… I have the time now so I decided to push the project forward a bit more. I’ve managed to implement some basic chart types, line, bar, pie and table. I’ve created data sources for reading the syslog and summarizing it and for getting the machine’s process, memory, and disk statistics. I’ve written a driver script that loads a JSON configuration file that sets up the pages, panels and graphs of the dashboard and displays them and allows interaction as well as an unattended cycling kiosk mode. At this point I think this thing could actually be useful. Here’s a short demo of it running:

There’s a few things that I want to add in the near future:

  • Ability to monitor other systems via ssh

  • A flexible data source for querying elasticsearch so folks could use it with an existing Elastic Stack deployment

  • Management of credentials using the system keyring so it can auto connect and self deploy through ssh to multiple systems

The sub-modules I think might be useful for other applications since they are pretty general and not coupled to this particular application.

It’ll be fun to show the next steps…